This is my third set of race stats from the 2015 Walt Disney World Marathon Weekend. If you find this interesting you might want to see my scatter plots of all finishers and histograms of finishing times.
Thanks to some help from my friend Will and someone on StackOverflow I’m finally able to run stats by corral.
Let’s start with the Half Marathon and Full Marathon. Those had the same number of corrals (16) whereas the 10K only had 6.
I started by calculating the median finishing time per corral. I was surprised to see that the last corral had a slightly faster median than the one before it. I suspect that this is because people without a previous qualifying time were put in the last corral, so folks who are more serious runners who are running their first Half Marathon might have been stuck back there. There was also a huge group of A runners who came in dead last, I expect these were course sweepers or other specifically paced volunteers.
Pace is in minutes per mile.
| Half Marathon | Full Marathon | |||||
| Corral | Median Time | Pace | # Runners | Median Time | Pace | # Runners |
| A | 1:42:26 | 7:49 | 508 | 3:38:53 | 8:21 | 519 |
| B | 1:47:07 | 8:11 | 336 | 3:41:49 | 8:27 | 373 |
| C | 1:56:18 | 8:52 | 656 | 3:58:14 | 9:05 | 704 |
| D | 2:02:47 | 9:22 | 722 | 4:10:45 | 9:34 | 758 |
| E | 2:06:45 | 9:40 | 755 | 4:24:55 | 10:06 | 767 |
| F | 2:15:03 | 10:18 | 1148 | 4:39:07 | 10:39 | 1138 |
| G | 2:19:49 | 10:40 | 1217 | 4:46:08 | 10:55 | 1223 |
| H | 2:28:57 | 11:22 | 1244 | 5:04:03 | 11:36 | 1172 |
| I | 2:36:08 | 11:55 | 1583 | 5:17:01 | 12:06 | 1518 |
| J | 2:44:10 | 12:31 | 1770 | 5:33:52 | 12:44 | 1737 |
| K | 2:53:51 | 13:16 | 1743 | 5:50:05 | 13:21 | 1613 |
| L | 3:02:28 | 13:55 | 1952 | 6:09:21 | 14:05 | 1948 |
| M | 3:06:32 | 14:14 | 1679 | 6:22:16 | 14:35 | 1509 |
| N | 3:11:19 | 14:36 | 2064 | 6:40:29 | 15:17 | 1704 |
| O | 3:13:17 | 14:45 | 1942 | 6:31:38 | 14:56 | 1440 |
| P | 2:54:27 | 13:19 | 2781 | 5:46:36 | 13:13 | 1864 |
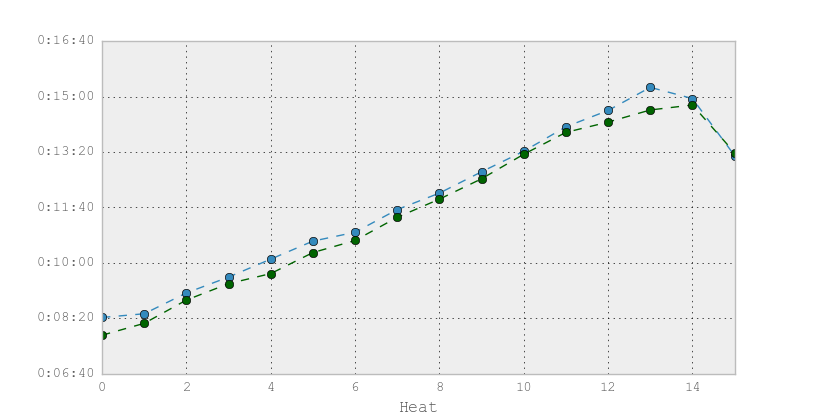
I thought it was interesting how close the median pace for each corral, despite the full marathon being twice as long. This poorly labeled graph shows the median pace for each heat. The heats have numbers instead of letters because I am not good at matplotlib.pyplot
Next we have a boxplot of finishing times grouped by heat.
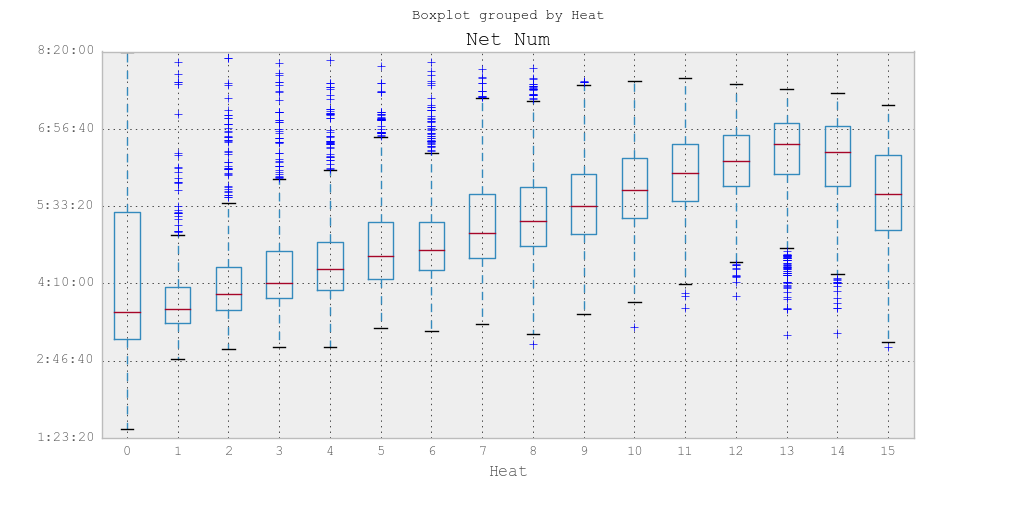
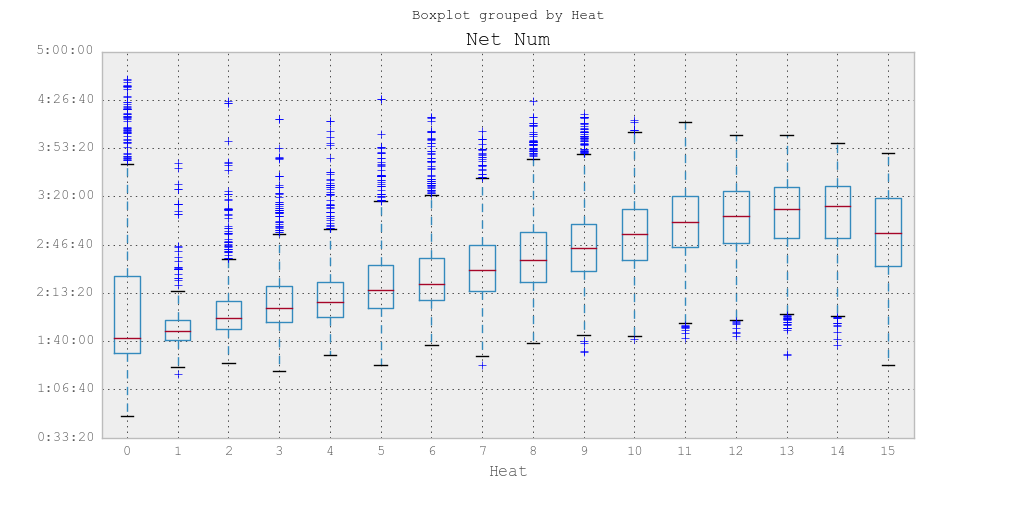
From this we can see that there are quite a few runners in heats 0-9 (corrals A through I) who should have been in a slower heat. Those in the slowest 25% of each heat came in later than the median of the next slowest heat. The runners outside the caps are outliers, meaning the algorithm decided those runners statistically did not belong in that heat. Even if we ignore heat A, which has a bunch of pace teams in it, there are clearly a bunch of people who were a bit optimistic with their corral placement. Likewise we see folks in the back corrals who will hopefully get better placement next time.
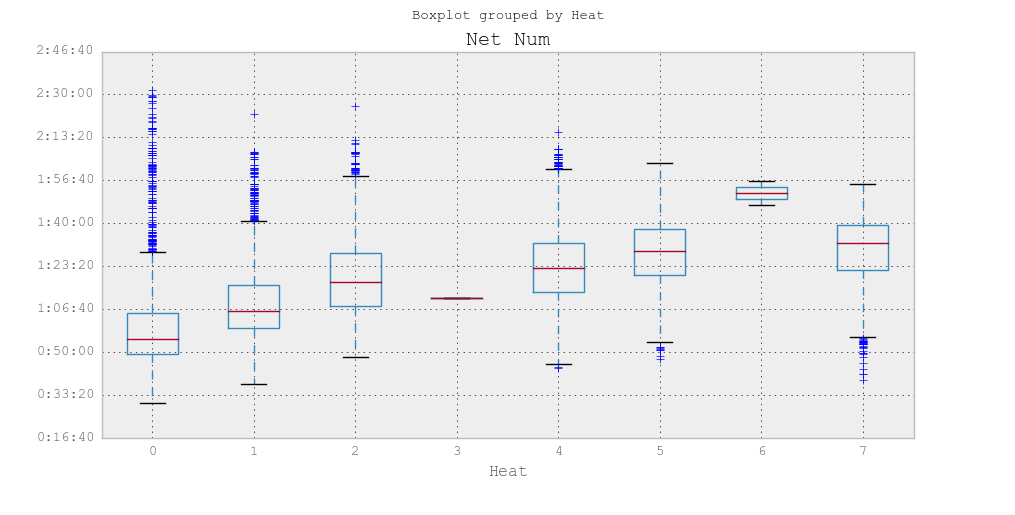
I had a little trouble breaking the heats out on the 10K (not sure what’s up with 4 and 7, those shouldn’t be there) but you can get the general idea. Corrals ABCDEF are heats 0 1 2 3 5 6 8 respectively.
Looking at these graphs I can gauge whether my friends and family were in an appropriate corral or not.
Chris: in corral B/1 for the half, finished in 1:47. Seems spot on.
Kate: in corral J/9 for the half, finished in 2:33. Also looks right.
Lorena: in corral P/15 for the half as she didn’t have a prior qualifying time. Finished in 2:03. E would have been more appropriate.
Matt: in corral O for the full. Finished in 4:29. E or F would have been more appropriate.
Dustyn: in corral D for the 10k. Finished in 1:03. B would have been more appropriate.
Me: In corral E for the 10k. Finished in 1:04. B would have been more appropriate.
So why does any of this even matter?
I believe strongly that running should be for everyone. I don’t really understand the people who run long distance race at a 16:00 pace, but it’s still an accomplishment. That said if you run for time it is extremely frustrating to get placed in a late corral and have to dodge walkers during the race. Likewise I’m sure it’s frustrating to have fast runners diving in front of you if you’re walking in the back of the pack. Appropriate corral placement is key to everyone enjoying themselves.
Based on this I suggest the following:
- If you run for time, make sure you run a qualifying race (if needed) ahead of time so you can get into an appropriate corral. If your race lets you self-report your expected time, give yourself some credit. When I signed up for the race I was running at a 12 minute pace, but was closer to a 10 by the time I finished training.
- If you don’t run for time, be honest. Don’t submit a time that puts you in the B corral if you have no intention of running that time.
- If you’re a new runner and want to run a friendly race where you won’t come in dead last, run a Disney race. Even if you do come in dead last, you’ll have plenty of company.
Before I wrap this up I have one more graph to show: a comparison of the finishing times at the Disney 10K vs the Philly 10k. I ran both, and came in about 6 minutes faster in the Disney 10k. Philly is purple, Disney is blue, and the dots are me. There were a different number of runners in the two races so I scaled them to match. The x axis shows place/total*100, which may or may not be the same as a percentile I’m not sure. I don’t think it is.
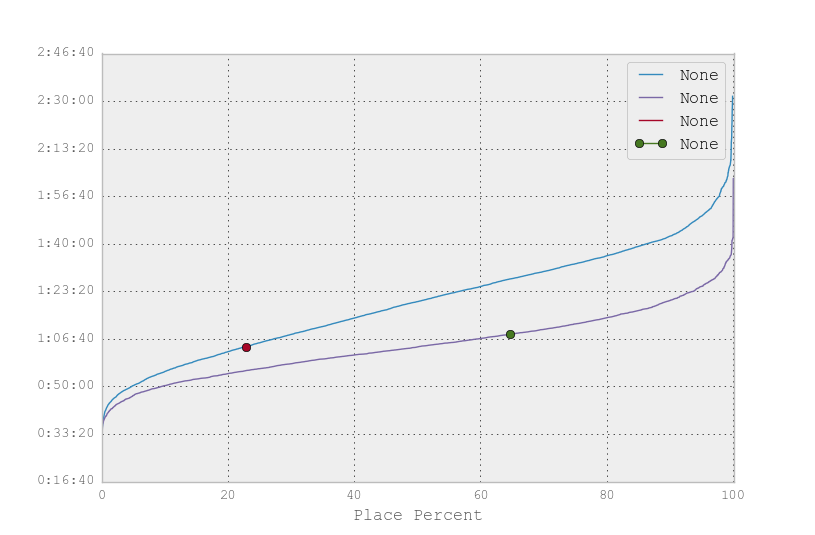
Conclusion: Disney races are slower than my local race. A time that puts you in the top 1/3rd at Disney has you in the bottom 1/3rd in Philly.
I’m about stats’d out, but the data is on github if anyone wants to play with it themselves. You’ll need to edit the scripts to work on your system, I just chucked them into git so they have file paths for my filesystem in them (and now you can all see that I run Windows).