Four of my family members and three of my friends ran races during the Walt Disney World Marathon Weekend this past week(end). Three of us felt correctly placed in our starting corrals, three of us felt the race was more of an obstacle course of slow-moving people. I started wondering about race stats and while I’m still sorting through them (and brushing off my rusty python skills) I did manage to come up with some fun histograms.

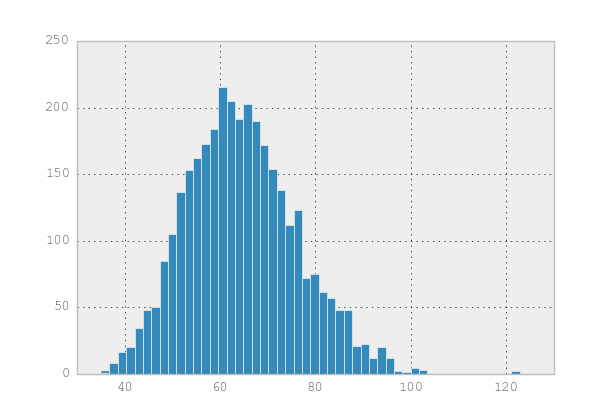
First we have the 10k, which was my race. I finished in 1:03:58, or about 64 minutes. Since I haven’t figured out how to control the labels on my graphs they’re just listed in minutes. My time, which is not a particularly exciting time to most runners, is surprisingly early in the graph. There’s also an interesting jump at 90 minutes. Keep in mind these are net times, not clock times, so even folks who started late but ran fast should be competitive here.
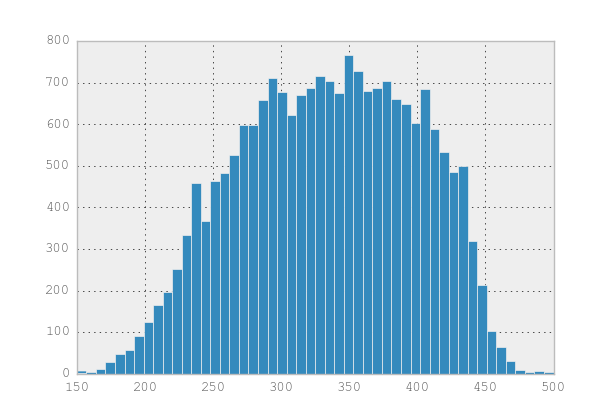
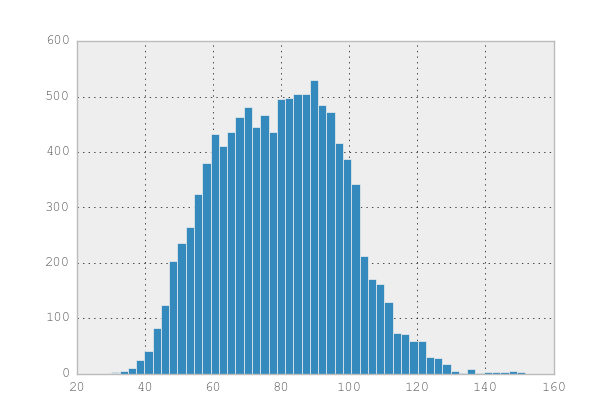
Next is the half marathon. There’s an interesting drop at 3 hours. The pace cutoff for all the races was 16:00 (and wasn’t strongly enforced) which would be a 3:30 half marathon. I’m not sure what caused the huge drop at 3 hours.Last we have the full marathon – 26.2 miles. I’m actually surprised there isn’t a longer tail on this graph given how many folks were walking and otherwise going slowly. I’d love to compare the shape of the histogram to other more serious runs, but those don’t have such easy-to-scrape data so it may be a while.
I’ll post more on the stats process as I work on them, but it may be a while since I’m on vacation (woo!)
Edit: Here’s the histogram for the Philly 10k in September. It’s a very different shape (and was also a much smaller race)